


Catalog of Regulatory Science Tools to Help Assess New Medical Devices
This regulatory science tool is a software tool that computes select controller response metrics relevant to physiologic closed-loop controlled (PCLC) medical devices. The tool accepts response data of a controlled physiologic variable collected from any testing modality, including in vivo animal studies, clinical studies, bench testing, or computational simulation, and calculates a set of closed-loop controller response metrics, including median performance error, median absolute performance error, wobble, percentage of time within target range, rise time, percentage overshoot, settling time, divergence, and steady state error.
Technical Description
Computation of Physiologic Closed-Loop Controller Response Metrics is a software tool that computes a set of closed-loop controller response metrics from time-series data of a controlled physiologic variable collected during PCLC engagement. The software code implementing the tool is available for MATLAB® R2023b and Python 3.14.5 environments. The tool is organized as a single callable function that accepts index-based inputs defining the controller engagement period, the controlled variable time-series, the corresponding time vector, the target value, and a disturbance signal, and returns an output containing the computed metrics. The tool computes the following metrics. Note that Steady State Error (SSE) is reported in the units of the controlled variable (mean arterial pressure (MAP)) based on the example described below. For other applications the units may be adjusted for the specific physiologic variable.
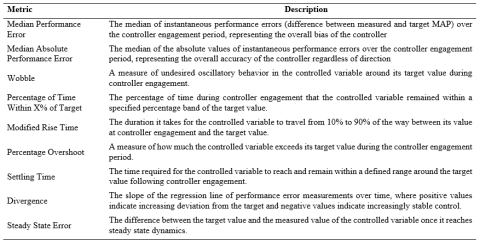
The performance metrics implemented in this tool are designed for PCLC evaluation scenarios in which the system may be subject to disturbances during the controller engagement period. In the representative use case of automated fluid resuscitation, these disturbances take the form of events that perturb MAP during closed-loop controller engagement. Several metrics, including settling time and steady state error, include specific provisions to account for the presence of known disturbances. Specifically, the steady state error computation uses a disturbance signal as an input to determine the appropriate steady state window, selecting the 2 minutes before the last disturbance when insufficient post-disturbance data are available for steady state assessment. For the automated fluid resuscitation example described in [1], the disturbance signal is the time when blood loss occurred. Users applying this tool to other PCLC applications can supply the appropriate disturbance signal for their specific context, or a zero vector if no disturbance is applied.
Intended Purpose
This tool is intended to help developers of physiologic closed-loop controlled medical devices estimate controller response metrics from data collected during non-clinical and/or clinical testing. A definition of PCLC medical devices is provided in the final FDA Guidance Document “Technical Considerations for Medical Devices with Physiologic Closed-Loop Control Technology” (2023) [3].
Testing
The tool has been tested in MATLAB® R2023b and Python 3.14.5 using examples with different manufactured MAP signals and disturbance profiles to compare the computed outputs to analytically derived reference values. An example dataset was also used to demonstrate that both versions of the code execute without error (See RST tool testing document). The metric definitions are derived from the peer-reviewed publications of Chalumuri et al. [1] and Varvel et al. [2], the latter of which established several of the core metrics - including MDPE, MDAPE, wobble, and divergence - as measures of computer-controlled infusion pump performance.
The performance metrics implemented in this tool were tested through their application in Chalumuri et al. [1], which conducted a comparative assessment of in vivo and in silico evaluation of automated fluid resuscitation controllers. In that study, the metrics were computed from MAP response data collected from eleven anesthetized swine subjects undergoing closed-loop fluid resuscitation with two controller speed modes - a slow controller (Controller I, n = 6) and a fast controller (Controller II, n = 5) - and from a corresponding set of 11,000 virtual subjects generated using a mathematical model of the cardiovascular system response to fluid perturbation. The ability of the metrics to distinguish between the two controller speed modes was assessed by comparing the distributions of each metric derived from the virtual cohort against the corresponding in vivo values. Additional information on the experimental conditions under which the metrics were tested is available in [1].
Limitations
The tool has been evaluated in the context of automated fluid resuscitation systems where MAP is the controlled variable and fluid infusion rate is the manipulated variable [1]. Application of the tool to other PCLC device types and physiologic variables is supported by the generality of the metric definitions; however, the clinical meaningfulness and appropriateness of the metrics for specific applications have not been evaluated. The tool does not include acceptance criteria or performance thresholds for any of the computed metrics.
The steady state error metric relies on the disturbance signal input to determine the appropriate steady state window. If the disturbance signal is not accurately provided, the steady state window selection may not correctly reflect the experimental conditions, potentially affecting the accuracy of the SSE computation. Similarly, the settling time and rise time metrics may return NaN for subjects in whom the controlled variable does not reach the target or does not remain within the settling tolerance for the required minimum duration; users may choose to report the proportion of subjects for whom each metric was computable when presenting aggregate results.
The tool does not perform any quality checking or artifact detection on the input data. Input data that contain artifacts or measurement errors may produce metric values that do not reflect controller response performance.
Supporting Documentation
The software codes, instructions for computing PCLC response metrics from a controlled physiologic variable response using the tool, and testing methods are available [here].
[1] Chalumuri et al. Annals of Biomedical Engineering, 54, pp. 857–868 (2026). https://doi.org/10.1007/s10439-025-03929-2
[2] Varvel et al. Journal of Pharmacokinetics and Biopharmaceutics, 20(1), 63–94 (1992). https://doi.org/10.1007/bf01143186
[3] FDA Guidance Document Technical Considerations for Medical Devices with Physiologic Closed-Loop Control Technology. September, 2023. https://www.fda.gov/regulatory-information/search-fda-guidance-documents/technical-considerations-medical-devices-physiologic-closed-loop-control-technology
Contact
Tool Reference
- RST Reference Number: RST26IP01.01
- Date of Publication: 7/14/2026
- Recommended Citation: U.S. Food and Drug Administration. (2026). Computation of Physiologic Closed-Loop Controller Response Metrics (RST26IP01.01). https://cdrh-rst.fda.gov/computation-physiologic-closed-loop-controller-response-metrics