


Catalog of Regulatory Science Tools to Help Assess New Medical Devices
This regulatory science tool (RST) is a phantom that enables assessment of a fundamental optical coherence tomography (OCT) system performance parameter.
Technical Description
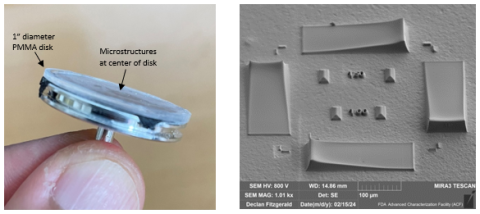
The sensitivity of an optical coherence tomography (OCT) system is defined as the minimum sample reflectivity to achieve an image signal-to-noise ratio (SNR) equal to one. The OCT sensitivity phantom contains four microstructures (230 mm length x 100 mm width) with a continuously varying surface slope angle with respect to the incoming illumination beam to vary the “effective” sample reflectivity. The sloped surface varies the amount of light returned from the sample within the collection aperture of the OCT system from a high effective reflectivity value (zero slope) down to a very low value (large slope). The phantom is made on a 1-inch diameter disk of polymethyl methacrylate (PMMA), as shown in the left panel of Figure 1. The microstructures, as shown in the right panel of Figure 1 under high magnification with scanning electron microscopy (SEM), are located at the center of the disk surface. A measure of sensitivity is obtained by acquiring an OCT image of this phantom and locating the position along the length of each reflective surface in the image where the signal level equals the noise level (i.e., SNR=1).
Intended Purpose
The phantom described in this tool is intended to provide a straightforward method to measure signal sensitivity of an OCT imaging device at signal levels near the system noise floor. This measurement approach is not routinely available but may offer a more direct representation of this important performance parameter.
Testing
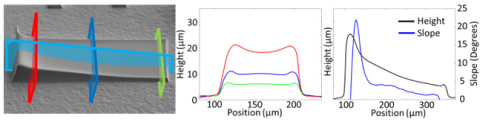
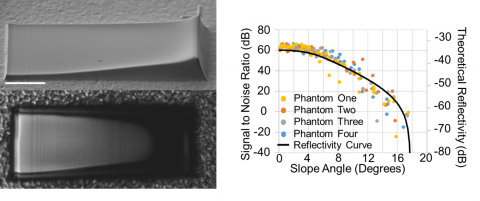
The slope angle along each microstructure was measured with stylus profilometry, and a representative profile is shown in Figure 2. The phantom was placed at the focal plane of a model eye (f=17.5 mm achromatic doublet lens) and imaged with a laboratory OCT setup designed for ophthalmic imaging with adaptive optics, which enhances lateral resolution. Figure 3 shows an OCT en face image of one microstructure and the SNR vs slope angle for microstructures across 4 phantom samples. The angle at which the SNR reaches 0 dB is a measure of sensitivity. With the known focal length of the model eye lens, the theoretical effective reflectivity across the length of the microstructures could be determined and plotted along with the SNR values.
Limitations
Optimal results are obtained when each microstructure occupies thousands of pixels in the en face OCT image. Some OCT systems may be limited in their minimum field of view and maximum pixel sampling density to achieve this pixel count, given each microstructure’s surface area is only 230 x 100 mm2.
Supporting Documentation
D. M. Fitzgerald, J. Guag, Z. Liu, D. X. Hammer, R. D. Sochol, and A. Agrawal, “Tailored Reflectivity Microstructures for Measuring Signal Sensitivity of Optical Coherence Tomography Medical Imaging Systems,” Adv. Mater. Technol., e01959 (2025). https://doi.org/10.1002/admt.202401959.
Contact
Tool Reference
- RST Reference Number: RST26OM07.01
- Date of Publication: 7/27/2026
- Recommended Citation: U.S. Food and Drug Administration. (2026). Phantom for Measuring Signal Sensitivity of Optical Coherence Tomography (OCT) Imaging Devices (RST26OM07.01). https://cdrh-rst.fda.gov/phantom-measuring-signal-sensitivity-optical-coherence-tomography-oct-imaging-devices