
Catalog of Regulatory Science Tools to Help Assess New Medical Devices
DxGoals is a freely-accessible, RShiny software application that is intended to determine and visualize performance goals for common diagnostic test classification accuracy metrics including sensitivity, specificity, positive likelihood ratio, and negative likelihood ratio. Model outputs are dependent on user inputs of desired risk stratification (pre- and post-test probabilities of the target condition). The tool also analyzes whether goals are met with statistical significance.
- Github Webpage: https://github.com/DIDSR/DxGoals
- Link to Software: https://fda-cdrh-osel-didsr-rst.shinyapps.io/DxGoals/
Technical Description
Software Interface
DxGoals was developed on the R-Shiny platform. Users can access the software freely at https://fda-cdrh-osel-didsr-rst.shinyapps.io/DxGoals/. Figure 1 displays the DxGoals interface.
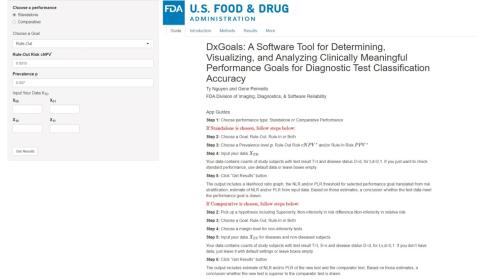
Figure 1. DxGoals interface.
The right panel includes 5 tabs:
- Guide on using the application,
- Introduction motivating the risk stratification framework,
- Methods describing the statistical methodology,
- Results generated when from the user inputs data,
- More generates an extra result (see Section 10 Appendix: Numerical Examples).
The left panel allows users to interact with and control the application, i.e., select appropriate options and specify inputs. The users can choose the standalone or comparative performance option.
If the standalone option is selected, then users choose a goal (rule-in, rule-out, or both), input the desired risk stratification: prevalence p, risk threshold PPV* for ruling in treatment or work-up for the target condition given a positive test result, and / or risk threshold cNPV* = 1 - NPV* for ruling out treatment or work-up for the target condition given a negative test result. Users may also input data for analysis (optional) of the computed goals for NLP, PLR, Se, and Sp.
If the comparative option is selected, then users choose the hypothesis – superiority or noninferiority in risk difference or relative risk – a goal (rule-in, rule-out, or both), and a non-inferiority margin if non-inferiority was chosen. Users may also input data for analysis (optional).
After completing all inputs, users click on “Get Results” button to get the results.
Intended Purpose
Scope: DxGoals is applicable to all diagnostic tests with binary output for diagnosing presence or absence of a target condition.
Purpose: DxGoals calculates goals for sensitivity (Se), specificity (Sp), and negative (positive) likelihood ratio NLP (PLR), which facilitate product development and regulatory evaluation because they facilitate discussion between regulators and sponsors as to what goals are appropriate for a test’s intended use. Goals for Se, Sp, NLR, and PLR are especially useful for tests of low prevalence conditions because these metrics are prevalence independent and thus are estimable in studies enriched for the condition, e.g., case-control studies and multi-reader, multi-case (MRMC) studies of diagnostic imaging modalities. DxGoals also provides analysis of the computed goals when data are input (optional)s. DxGoals also determines goals for non-inferiority and superiority of an investigational test vs a control test and provides analysis of these goals when data are input.
Testing
The tool has been tested to verify that each module works as intended. The outputs of each function have been validated manually. Specifically, the following outputs have been validated:
- computation of the goals for sensitivity, specificity, and negative (positive) likelihood ratio NLR (PLR) corresponding to risk stratification inputs,
- likelihood ratio graph visualization of these goals,
- confidence intervals for these metrics when data are input, and
- comparative analyses of the superiority and non-inferiority of a test with another test in risk stratification based on special likelihood ratio comparisons.
Limitations
The prevalence p of the target condition is a key component of the risk stratification (cNPV*, p, PPV*) input that DxGoals uses to the compute the goals for NLR, PLR, SE, and Sp. If p is based on a sample estimate, then to account for uncertainty in the true value p a sensitivity analysis may be considered in which p is set to the lower and upper limits of its 95% confidence interval to determine a range of potential goals for NLR, PLR, SE, and Sp.
The risk thresholds cNPV* and PPV* for ruling in and ruling out the target condition (for treatment or work-up) given negative and positive test results, respectively, are preferences that may vary with doctor and patient. At the population level, cNPV* and PPV* are typically determined from clinical management guidelines or literature. Alternatively, they may be derived from statistical decision theory by quantifying the net benefit of treating vs. not treating someone with the target condition and net harm of treating vs. not treating someone without the target condition.
When evaluating whether Test B is non-inferior to Test A in rule-out risk differences p - cNPV with respect to multiplicative non-inferiority margin γ₀, DxGoals approximates the success criterion p – cNPVᴮ > γ₀ × (p – cNPVᴬ) with the prevalence-independent criterion 1 − NLRᴮ > γ₀ × (1 − NLRᴬ), which is an excellent approximation when p small (Pennello 2021).
When evaluating whether Test B is non-inferior to Test A in rule-in risk differences PPV − p with respect to non-inferiority margin γ₁, DxGoals approximates the success criterion PPVᴮ − p > γ₁ × (PPVᴬ – p) with the prevalence-independent criterion as PLRᴮ – 1 > γ₁ × (PLRᴬ – 1), which is conservative (Pennello 2021).
DxGoals assumes observations are independent. Thus, it is not intended for repeated measures studies or longitudinal studies.
Supporting Documentation
- The Github site (https://github.com/DIDSR/DxGoals) includes a DxGoals Guide and Introduction.
- DxGoals software (https://fda-cdrh-osel-didsr-rst.shinyapps.io/DxGoals/) includes a Guide, Introduction, and Methods.
- Pennello (2021) describes the statistical methods in detail.
- Nguyen and Pennello (2024) reviews the statistical methods, describes the DxGoals software, and provides numerical examples.
References:
Biggerstaff BJ. Comparing diagnostic tests: a simple graphic using likelihood ratios. Stat Med. 2000; 19: 649-63.
Erickson Z, Rocca WA, Smith CY, Gazzuola Rocca L, Stewart EA, Laughlin-Tommaso SK, Mielke MM. Time Trends in Unilateral and Bilateral Oophorectomy in a Geographically Defined American Population. Obstet Gynecol. 2022; 139: 724-34
Katki HA, Schiffman M, Castle PE, Fetterman B, Poitras NE, Lorey T, Cheung LC, Raine-Bennett T, Gage JC, Kinney WK. Five-year risks of CIN 3+ and cervical cancer among women who test Pap-negative but are HPV-positive. J Low Genit Tract Dis. 2013;17:S56-63.
Nguyen N, Pennello GA. DxGoals: A Software Tool for Determining and Analyzing Clinically Meaningful Classification, J Applied Laboratory Medicine, 2024. 9(5):952-962.
Pennello GA. Classification accuracy goals for diagnostic tests based on risk stratification. Biostatistics & Epidemiology 2021; 5:149-68.
Perkins RB, Guido RS, Castle PE, et al. 2019 ASCCP Risk-based management consensus guidelines for abnormal cervical cancer screening tests and cancer precursors. J Low Genit Tract Dis 2020; 24: 102–31
SEER*Explorer: An interactive website for SEER cancer statistics [Internet]. Surveillance Research Program, National Cancer Institute 2023; [updated: 2023 Nov 16; cited 2023 Dec 10]. https://seer.cancer.gov/statistics-network/ , Accessed December 11, 2023.
Skates SJ, Gillette MA, LaBaer J, et al. Statistical design for biospecimen cohort size in proteomics-based biomarker discovery and verification studies. J Proteome Res. 2013; 12: 5383–5394.
Contacts
Tool Reference
- RST Reference Number: RST24MD19.01
- Date of Publication: 09/22/2025
- Recommended Citation: U.S. Food and Drug Administration. (2025). DxGoals: A Software Tool for Determining, Visualizing, and Analyzing Performance Goals for Diagnostic Test Classification Accuracy (RST24MD19.01). https://cdrh-rst.fda.gov/dxgoals-software-tool-determining-visualizing-and-analyzing-performance-goals-diagnostic-test